

Tracking Quote Performance
Last updated: Feb 2026
Estimated time to complete: 5 min.
Applies to: Air Conditioning Engineers
Summary
Monitor how your quotes are performing. Track conversion rates, response times, and identify what's working and what needs improvement.
Understanding how your quotes perform is key to growing your business. Quotestack tracks every stage of the quote journey, giving you the data you need to improve conversion rates, speed up response times, and close more deals.
Key Performance Metrics
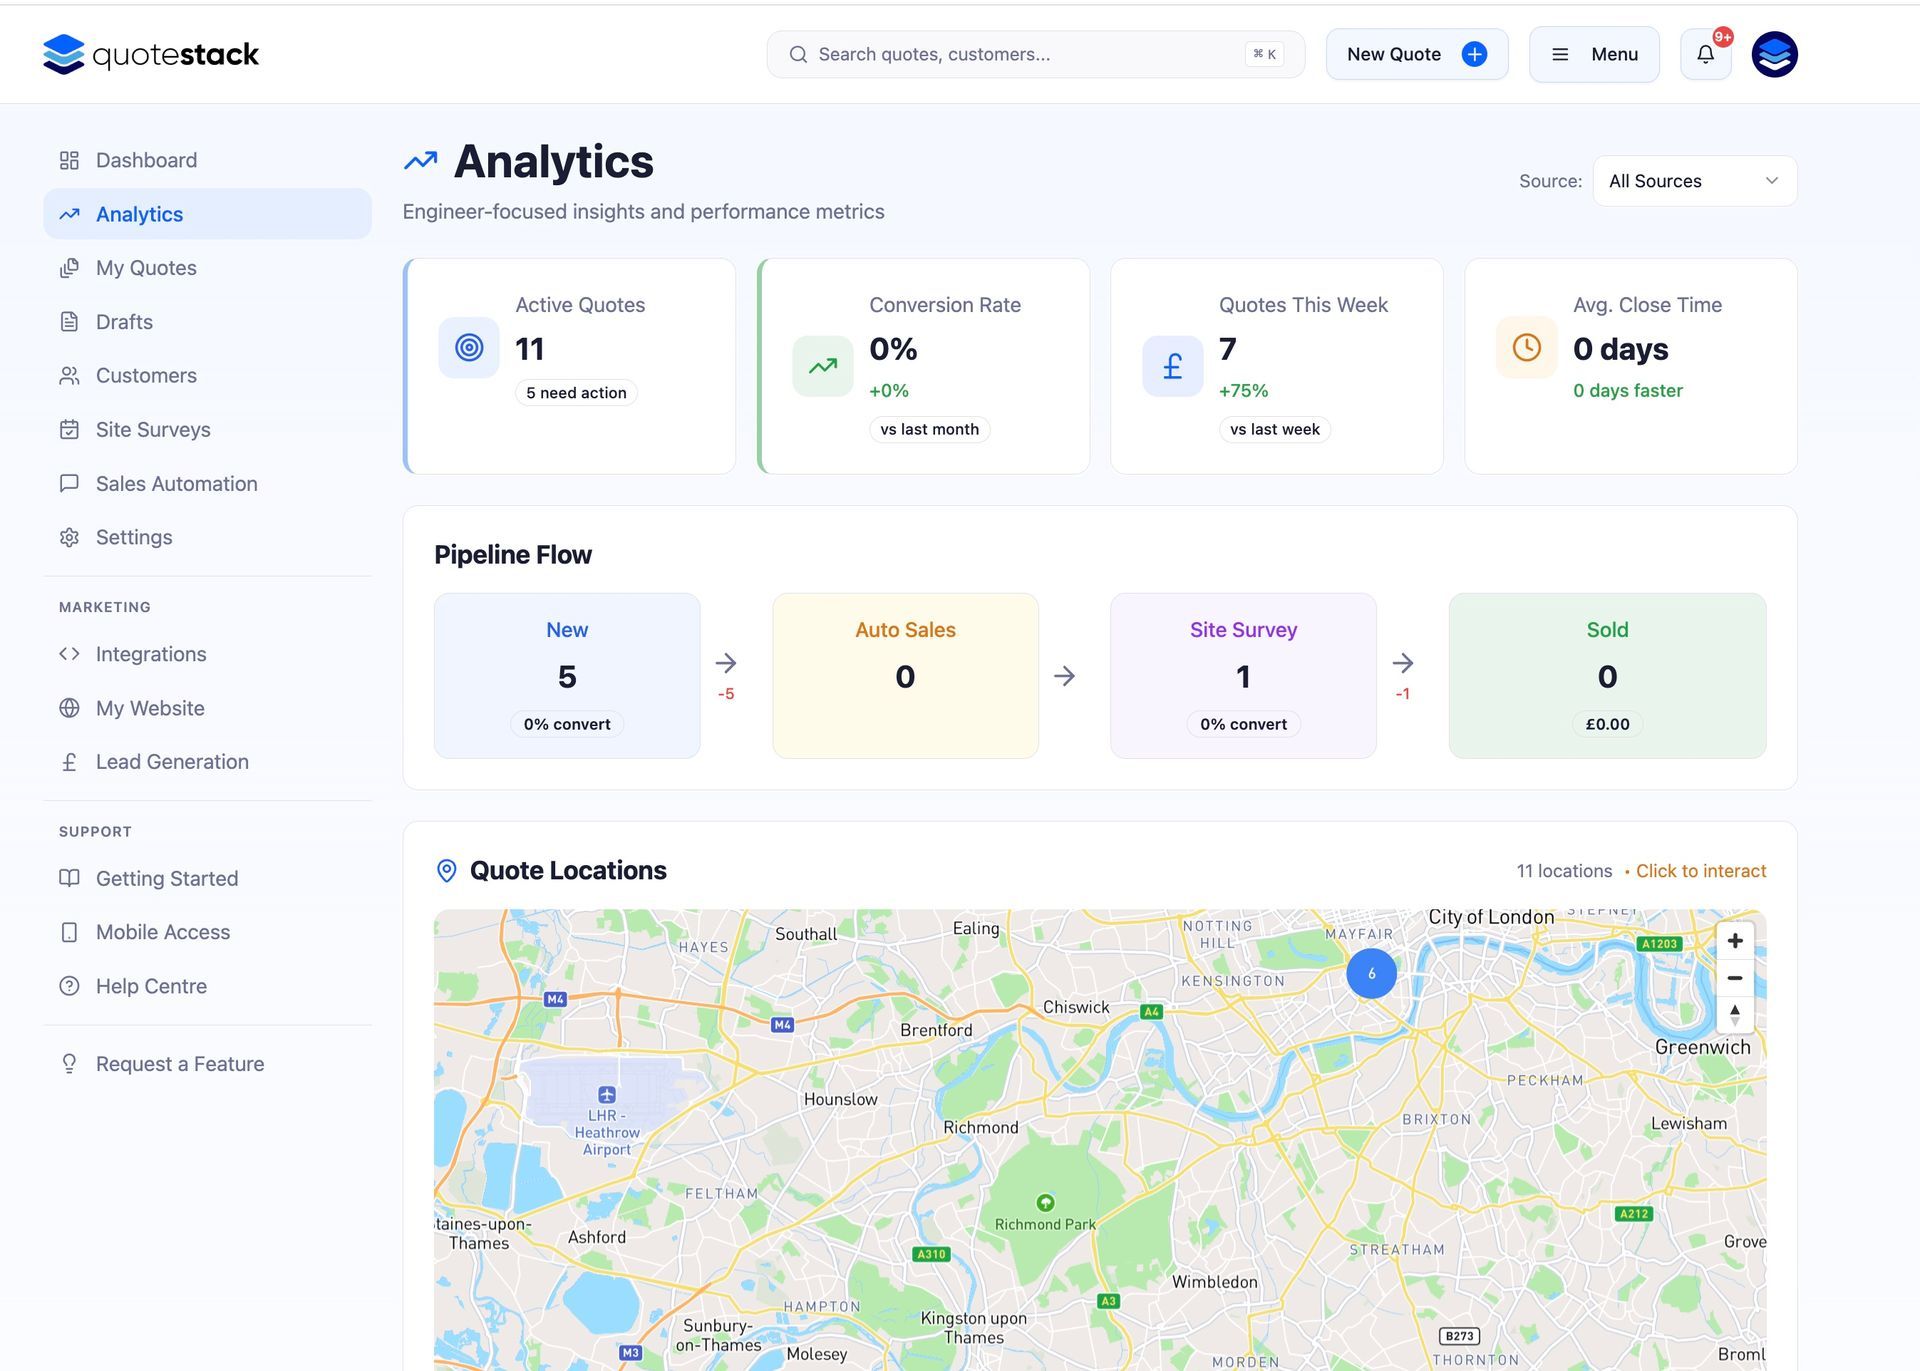
The Analytics page provides several performance indicators that tell you how effectively your quotes are converting:
Conversion rate - the percentage of sent quotes that are accepted. This is your most important metric. It tells you how competitive your pricing and presentation are
Average response time - how long customers take to respond after receiving a quote. Faster responses usually mean better engagement
Quote-to-sale ratio - the number of quotes you need to create to win one job. A lower ratio means more efficient quoting
Average quote value - tracks whether you're quoting for larger or smaller jobs over time
Note
A healthy conversion rate for HVAC quoting is typically 30–50%. If yours is below 20%, review your pricing, follow-up timing, and quote presentation.
Tracking Quote by Status
The pipeline view shows where your quotes are at any given moment. Use status tracking to identify bottlenecks:
Many quotes stuck at Sent - customers may not be opening your emails. Check your subject lines and sender name
High Viewed but low Accepted - customers are looking but not committing. Your pricing may be too high, or the quote may lack detail
Low follow-up engagement - your follow-up emails may need more compelling content or better timing
High Rejected rate - investigate whether specific property types, brands, or price ranges are being rejected more often.
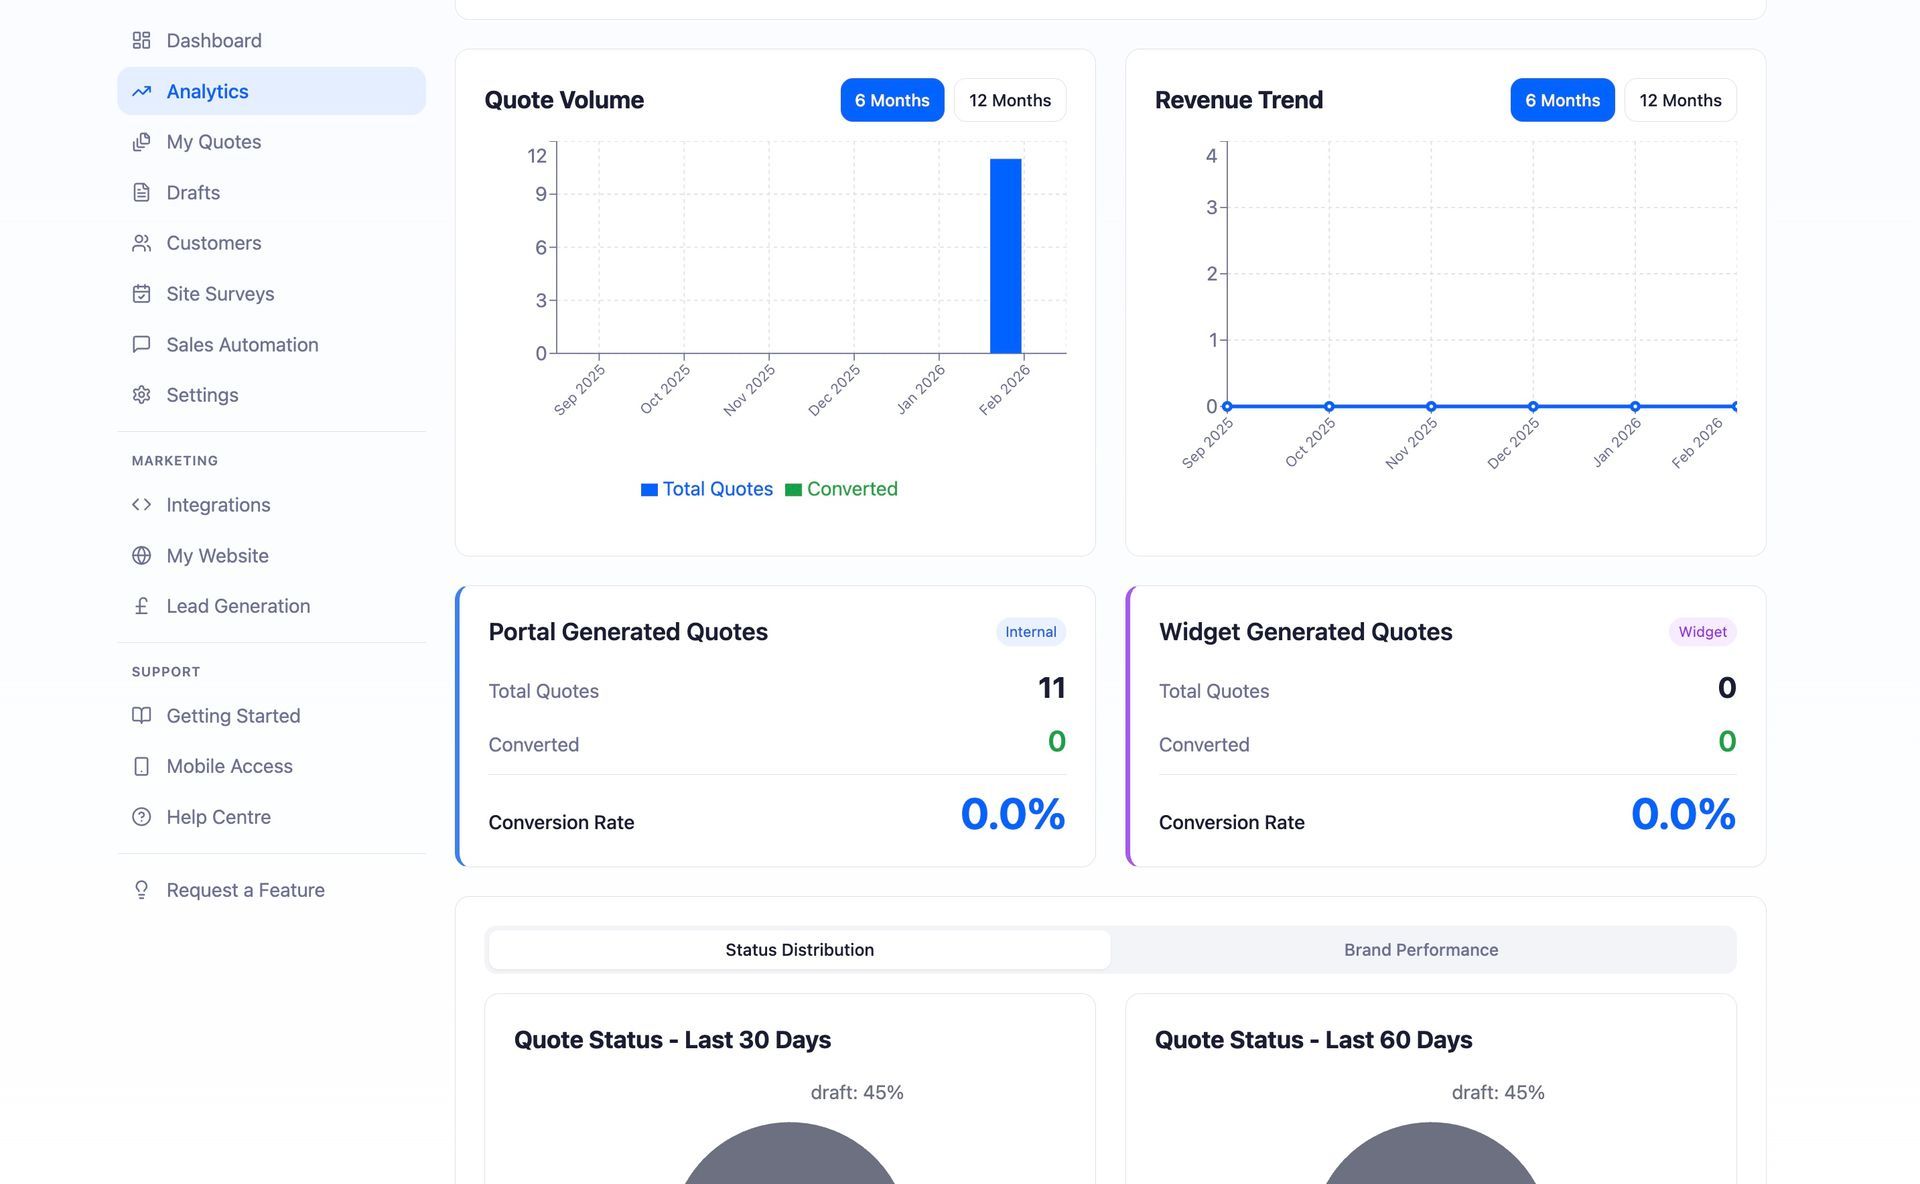
Quote Source Performance
Compare how quotes from different sources perform:
Platform quotes -created by you or your team directly. These typically have higher conversion rates because you've already spoken to the customer
Widget quotes - submitted by customers through your website. These are colder leads but can be high volume. Track their conversion separately to measure your website's effectiveness
Warning
If widget quotes have a significantly lower conversion rate than platform quotes, it may indicate that website visitors have different expectations or that follow-up speed needs improvement.
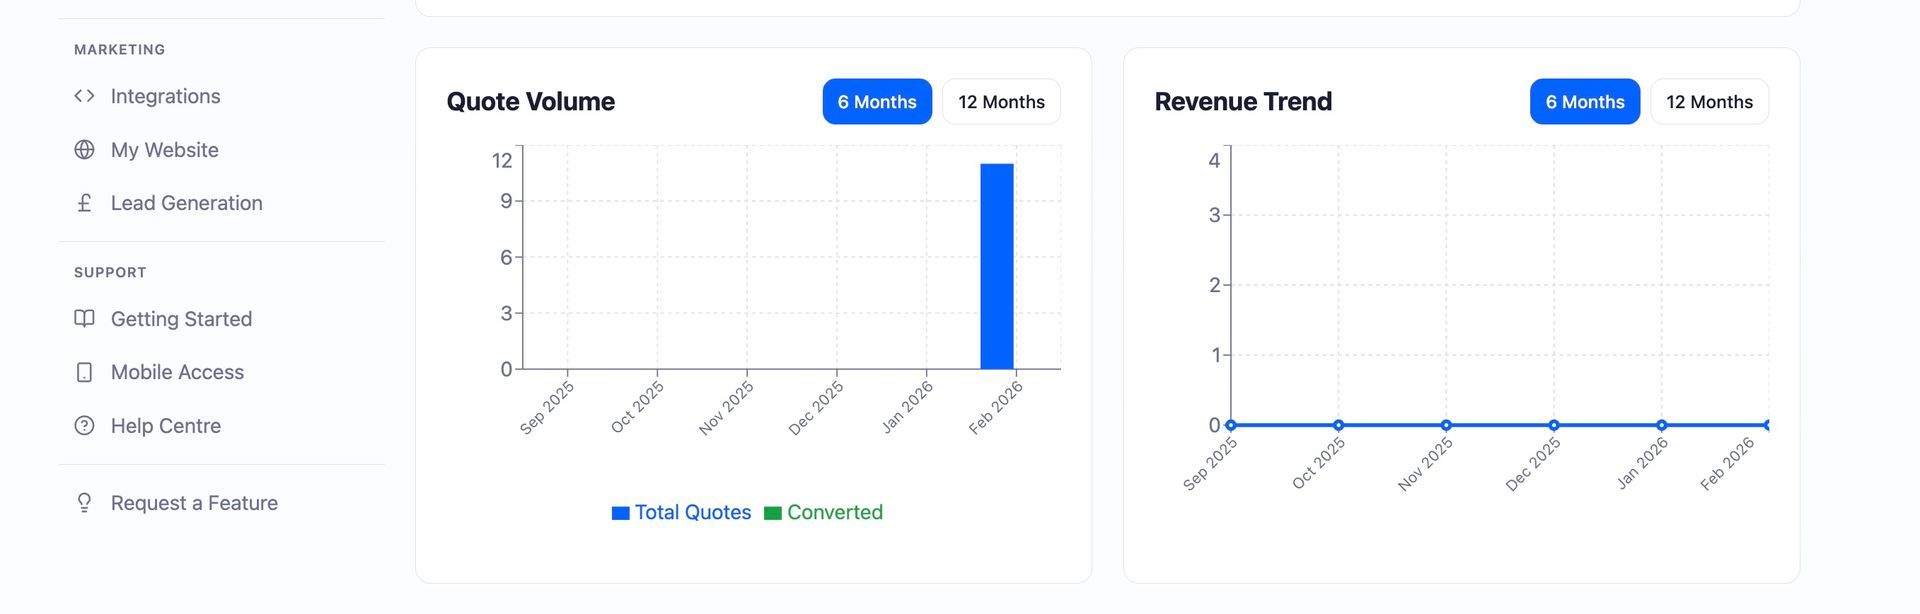
Time Based Trends
Track your performance over time to spot patterns:
Weekly trends - are you creating more quotes this week than last?
Monthly comparisons - how does this month's conversion rate compare to previous months?
Seasonal patterns - Air conditioning demand typically peaks in spring and summer. Plan your resources accordingly
Year-over-year growth - compare this year's revenue and volume against last year to measure business growth
Improving Your Numbers
Here are proven strategies to improve quote performance based on your data:
Speed up response time - follow up within 2 hours of a widget submission for the best conversion rates
Optimise follow-ups - test different follow-up timings and email content. The first follow-up at day 3 typically has the highest impact
Review rejected quotes - look for patterns in why customers say no. Is it price, timing, or scope?
A/B test your approach - try offering tiered pricing options on some quotes to see if flexibility improves conversion
Keep statuses updated - accurate data depends on promptly marking quotes as Accepted, Rejected, or Expired
Note
Set aside 10 minutes each Monday morning to review last week's performance. Small, consistent improvements compound into significant business growth over time.
Did this answer your question?
😃
😐
😞
Great! We’re glad we could help.
Not quite what you needed? Discover more articles here
If you'd like you can ask our team