

Analytics Dashboard Explained
Last updated: Feb 2026
Estimated time to complete: 5 min.
Applies to: Air Conditioning Engineers
Summary
A complete guide to the Analytics page. Understand your metrics, pipeline flow, charts, and how to use data to grow your business.
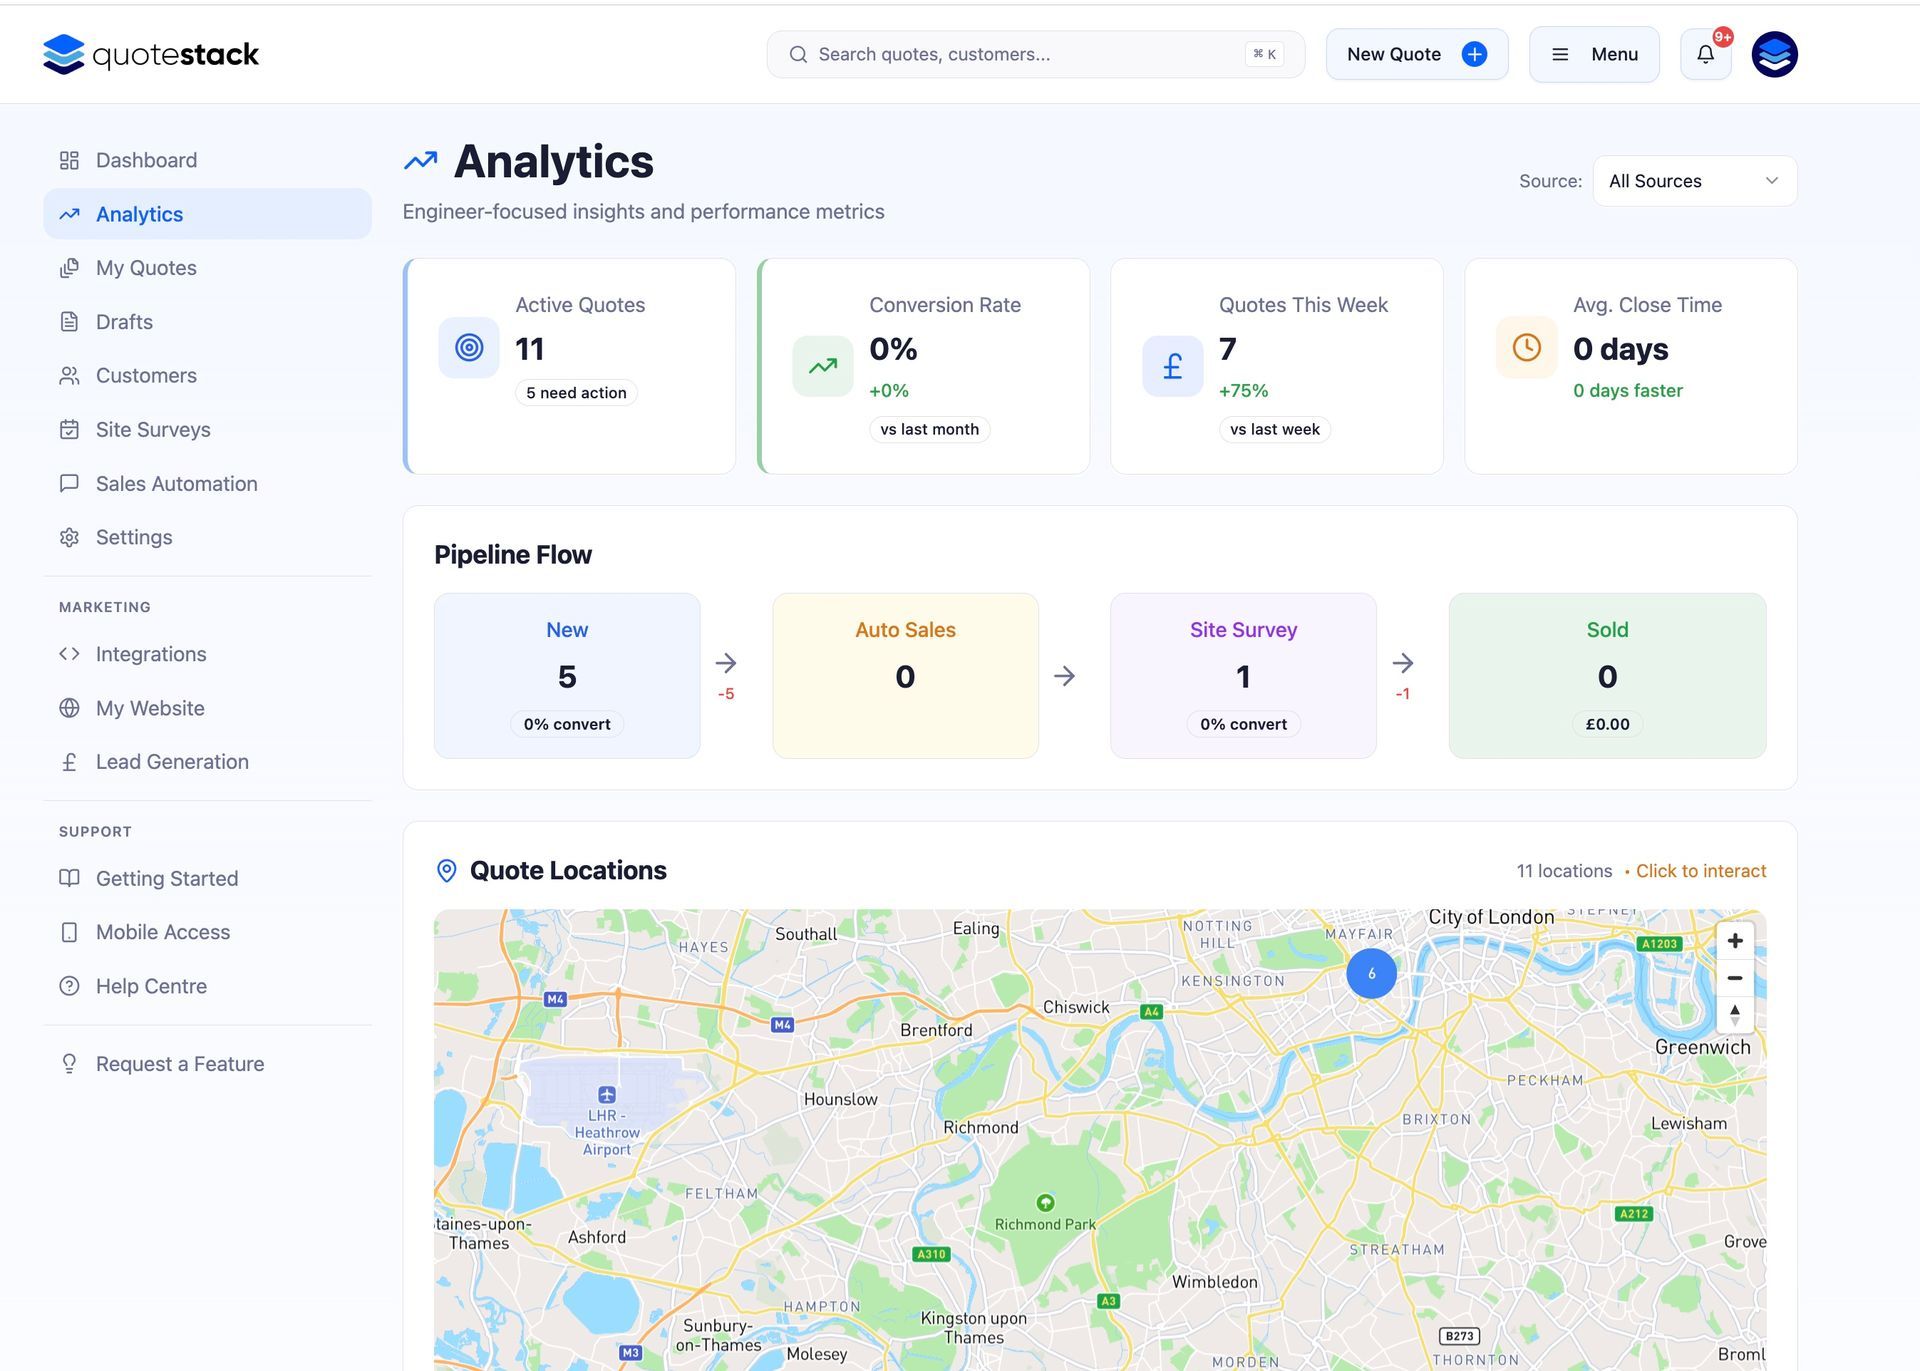
The Analytics page gives you a data-driven view of your quoting business. It goes beyond the Dashboard's quick snapshot to provide detailed metrics, trends, and pipeline visualisations that help you understand performance and identify opportunities.
Key Metrics
At the top of the Analytics page, you'll see headline stat cards that summarise your performance:
- Total Quotes - the number of quotes created in the selected period
- Total Revenue - the combined value of accepted/sold quotes
- Conversion Rate - the percentage of sent quotes that resulted in a sale
- Average Quote Value - the mean value across all quotes in the period
- Quotes Sent - how many quotes were delivered to customers
- Quotes Accepted - the number of quotes the customer agreed to
Note
Use these headline metrics to quickly gauge business health. A dropping conversion rate might indicate pricing issues, while a rising average quote value suggests you're winning bigger jobs.
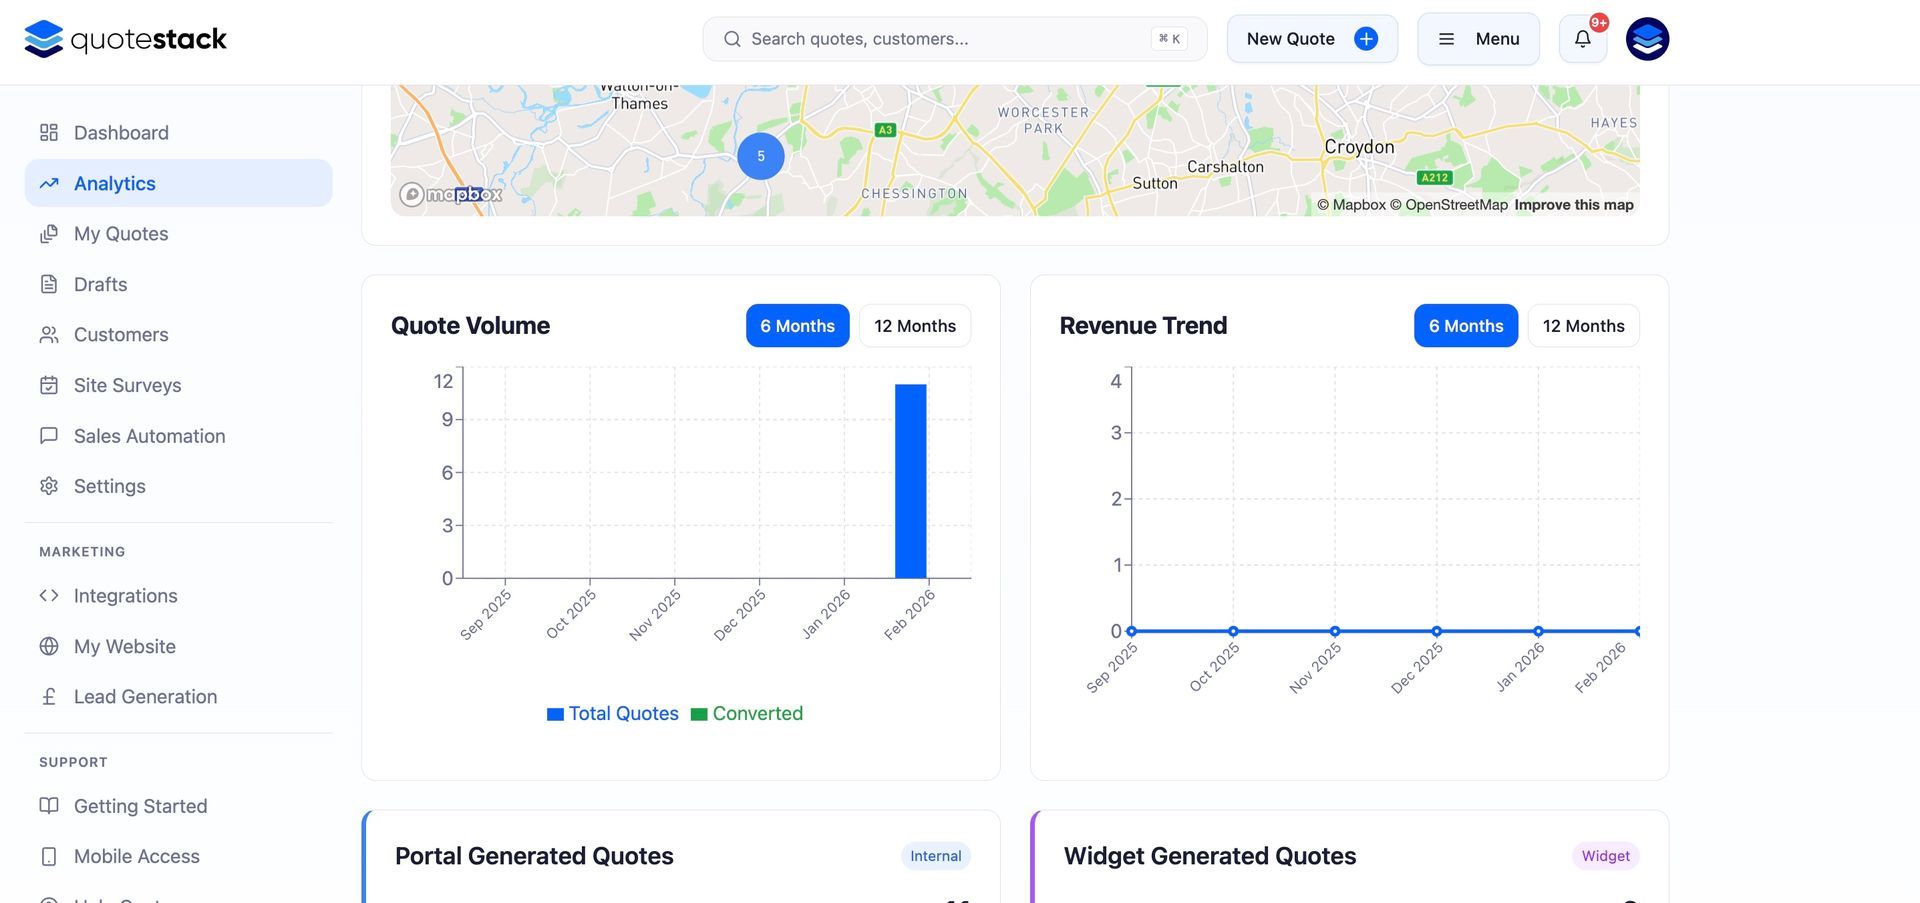
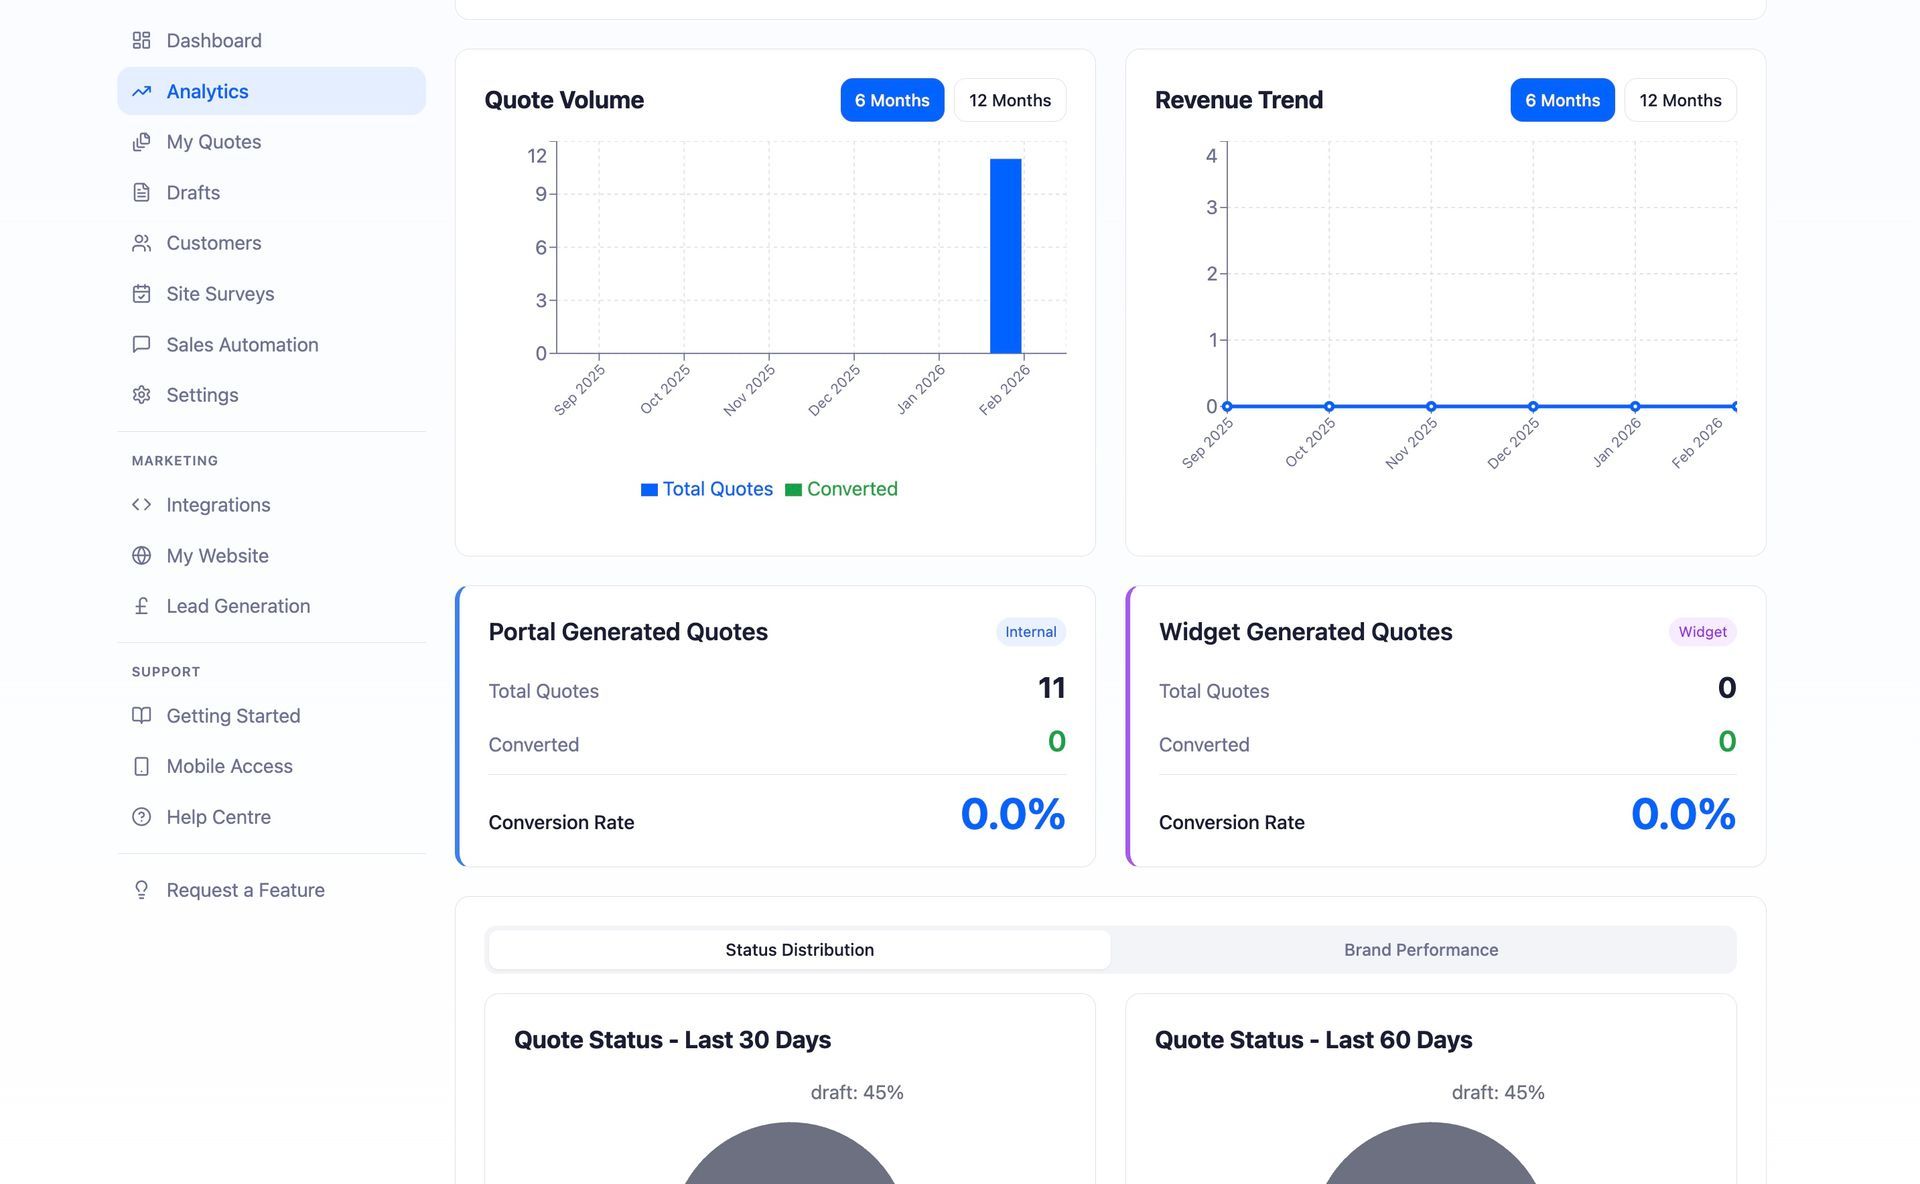
Quote Trends Chart
The trends chart shows your quoting activity over time. It plots the number of quotes created, sent, and accepted on a timeline so you can spot patterns, seasonal trends, and the impact of marketing campaigns.
- Upward trends in quotes created suggest growing demand or better lead generation
- A gap between quotes sent and quotes accepted highlights conversion opportunities
- Seasonal dips are normal in HVAC - use quieter periods to refine your equipment catalogue and pricing
Revenue Breakdown
The revenue section shows where your income is coming from. This can include breakdowns by quote source (platform vs widget), by property type, or by time period — helping you understand which types of work are most profitable.
Quote Source Analysis
If you're using the website widget alongside platform quotes, the source analysis shows how many quotes come from each channel. This helps you measure the return on your website widget investment and understand how customers prefer to request quotes.
- Platform quotes - created by you or your team directly in Quotestack
- Widget quotes - submitted by customers through the embedded quote form on your website
Note
A high volume of widget quotes with a low conversion rate might mean your website is attracting the wrong audience — or that widget quotes need faster follow-up.
Using Analytics to Improve Performance
Here are practical ways to use your analytics data:
- Low conversion rate - review your pricing, follow-up timing, and quote presentation. Are you competitive? Are you following up quickly enough?
- High average quote value but few sales - you may be pricing too high for your market. Consider offering tiered options or discounts
- Many quotes stuck at Sent - your follow-up emails may not be compelling. Review your automation templates
- Widget quotes converting better than platform quotes - invest more in your website and widget visibility
- Seasonal patterns - plan ahead for busy periods by stocking equipment and scheduling team capacity
Warning
Analytics data is only as good as your quote management. Make sure you update quote statuses promptly (especially Accepted and Rejected) to keep your metrics accurate.
Check your Analytics page regularly — even a quick weekly glance helps you stay on top of trends and catch issues early before they impact your business.
Did this answer your question?
😃
😐
😞
Great! We’re glad we could help.
Not quite what you needed? Discover more articles here
If you'd like you can ask our team